Monthly Archives

October 2018

Stupidity and Wonder, and Examples That Relate To The Financial Market

By | Uncategorized
Martin-Capital-Advisors-Democracy-Cafe-Podcast

August 28, 2018

Listen in as Paul — a graduate of St. John’s College and erstwhile commander of a reserve Navy SEAL unit — compellingly challenges much of the conventional wisdom of ‘experts’ when it comes to investing, the stock market, and the economy as a whole.

In the process, you might well discover how better to create a roadmap for achieving greater excellence — what the Greeks of old called ‘arete’ – in all dimensions of life.

Third Quarter Stock Market Advance Stalls as Program Selling Knocks Back Gains

By | The Compass
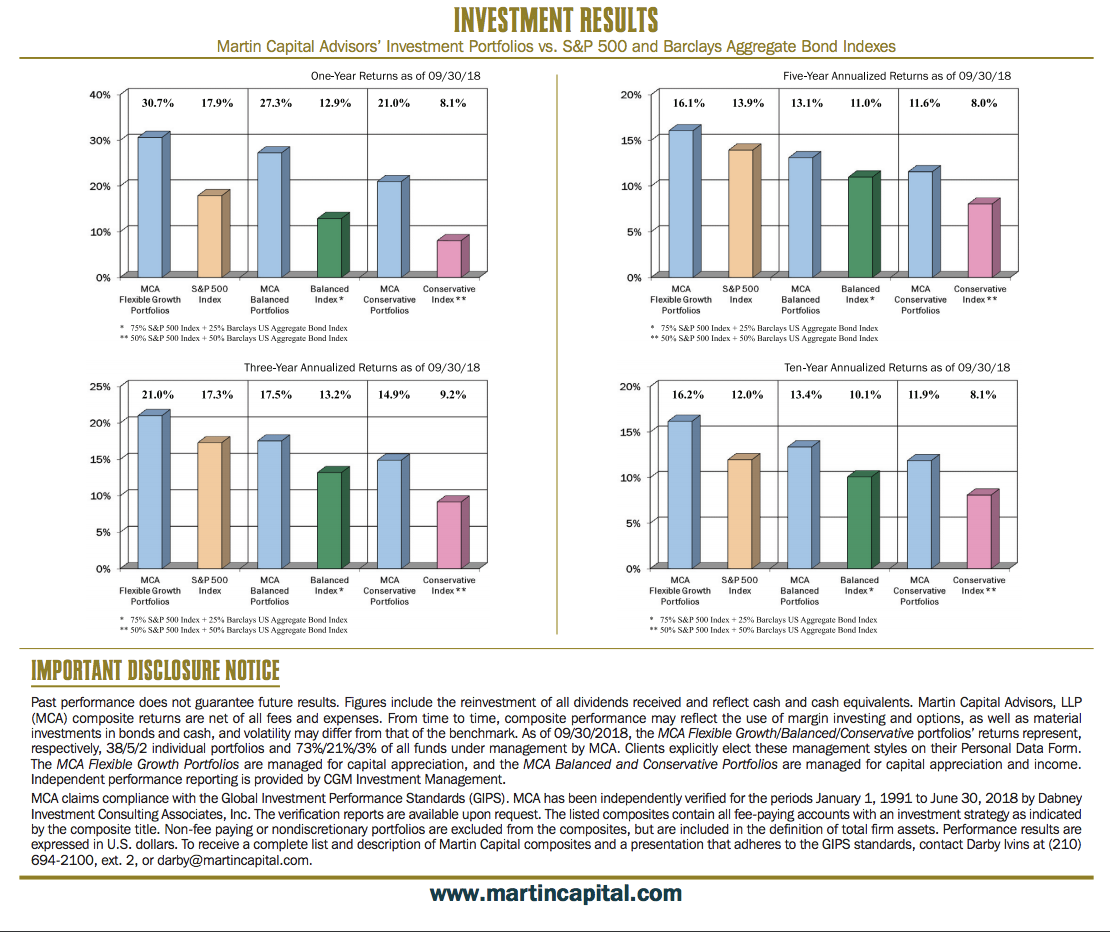
Martin-Capital-Advisors-Investment-Results-9-30-18

October 24, 2018

Stocks rallied in the third quarter, with the S&P 500 advancing +7.7%, resulting in a year-to-date return through the end of September of +10.6%. The ongoing strength in corporate earnings has been the primary driver of higher prices for the last two years. Bond returns were flat, with the Barclays Aggregate Bond Index generating 0.0% for the quarter and a year-todate return of –1.6%. Gold continued the down trend it has been in since April and the price of WTI Crude was off slightly for the three months ending September 30, but still up over +20% year-to-date. In a similar fashion to the stock market sell-off that began at the beginning of February, program selling has dampened year-to-date gains thus far in the fourth quarter. While there are some concerns about the prospects for corporate earnings next year, the recent decline in the stock market is not justified by any material weakness in earnings or the economy. The rise in bond yields, which may also have been a catalyst for the recent correction in stocks, has resulted in a further decline in bond prices. Gold prices have bounced back slightly since the beginning of the quarter and WTI Crude Oil has corrected even more than stocks so far in the fourth quarter. Despite the latest weakness in stocks, I remain fairly sanguine about the potential for the economy and corporate earnings, and the consequent potential for higher stock prices over the next year. That said, the Federal Reserve’s Fed Funds rate increases may start to have a significantly negative impact on the economy sometime next year, so it bears closely monitoring the possibility of a severe yield curve inversion and subsequent bear market in the next year or two. However, it is important to keep in mind that we are probably just at the beginning of a multi-generational bull market, so investment portfolios should be skewed towards stocks and their ability to outperform all other investment options over the long run.

Martin-Capital-Advisors-Returns-and-Growths-9-30-2018
Martin-Captial-Advisors-Growth-Protfolios-Top-20-Stocks-9-30-2018
Martin-Capital-Advisors-Multi-Year-Investment-Results-9-30-2018

Full Video – Long-Term Performance of Stocks, Bonds, T-Bills and Inflation 1926 – 2017

By | Videos

Transcript

Transcript for Long-Term Performance of Stocks, Bonds, T-Bills and Inflation 1926 – 2017

Youtube Video: https://www.youtube.com/watch?v=O4Sktrbbtrk

So thanks everybody for joining us and this is a event that we put together every several months I’d like to introduce Darby items over here one of my associates in Charlton Marcia and we will hang out after the meeting for a little bit if anybody wants to follow up with any questions and certainly feel free as I’m giving the presentation to ask any questions that you may have just just throw it out there if if I’m not if I don’t recognize you just ask the question no need to raise your hand so and I think most of you know I’m Paul Martin and this is a presentation that that I’ve done probably for twenty years now a couple times a year or at least once a year normally and it’s it’s pretty interesting actually looking at data so as opposed to just speculating about how things work and what happens and what have you and so hopefully you’ll see some worthwhile insights ears to go through it but the way I’d like to start out the meetings it’s just kind of a little bit of a roundtable discussion about the markets and any thoughts people have about where we’re at right now and and any questions that you might have of me as well in terms of my thoughts also so does anyone have any thoughts about the current economy and financial markets that you want to share or you want me to just make some confidence of it yeah that’s a good question but as you’ll see in this presentation their markets are very rare and as long as you don’t have what I call a severe yield curve inversion the market just generally goes up what you get from time to time is you can get some pretty serious sell offs in reaction to short-term factors 1987 be the best example where we went down from top to bottom almost 40% and in a matter of about six weeks but there was no catalyst except that it was just portfolio insurance just basically vicious cycle that was created we’re selling to get selling and just kept getting worse and worse and worse until finally it stopped but nobody can know I was gonna stop well because there were computers and so so a lot of financial institutions had what was called portfolio insurance and so they literally as the market went down they would sell futures against their portfolio to hedge it and then as I sold those futures that would drive the market down more it because in the futures traders would have to even out their positions by selling stocks and then as I sold the stocks and then the portfolio insurance would kick in and they’d sell futures again and it got into this vicious cycle that didn’t stop until we were down as I said almost 40% and of course that’s the cry on the crash day we were down 22 percent but the plan makings would go back and look at that time frame the economy was fine corporate earnings were fine there weren’t really any major world events that were factors it was simply computer related selling and so there a chance I could Anthony oh yeah I can happen again we had a flash crash here not too long ago that was computer generated selling and so you just have to be aware of that but if you’re a long-term investor he is looking and say well yeah it’s nice for cash there’s an opportunity to maybe you know get a little more exposure because stocks as you’ll see in the presentation that I mean they just go up over the long run it’s very unusual to have bear markets like what we had in 2008 they’re few and far between and I’ll get into the numbers here in a minute but no I I’m still fairly bullish on the stock market I’m bearish on bonds as I have been while and as I’ll show you in here you can give some long-term reasons for why I think that will persist that stocks will do better than bonds for quite some time in the future I’m talking literally like 20 years but yeah our back-and-forth sand will have a recession again here at some point and that’ll be good for bonds and will be negative for soccer and I’ll talk about that a little bit more here in a minute as well yeah the yield curve is flattening you know I’ve talked about the yield curve and we call it very closely and I’ll just mention to you guys that unto digress too much here on the presentation but the yield curve i’ve done a lot of research on it we now have a hedging strategy for hedging going into what are called yield curve conversions but those of you that aren’t familiar with it it’s basically when long rates are lower than short rates which is an unusual phenomenon driven by the Fed just continuing to raise rates until at some point along into the market which is market driven besides you know the feds really weakening the economy and a weak economy is good for bonds because you have less inflation in a weak economy and so when that happens banks pull back from lending because if you think about how the banks make money they make money on the spread between long rates and short rates and if you invert that spread then they don’t have much interest in lending money basically as you probably know they’re borrowing from their money market accounts and their savings accounts make loans for mortgages and business loans and that type of thing so you invert the curve and suddenly they’re really losing interest is lifting money and it becomes more and more difficult to get to borrow money and then the economy rolls over what what I found though with this study and the work that I’ve done putting together this hedging strategy is that it’s only in severe yield curve inversions which caused severe recessions that you really have bear markets that you can react to most recessions believe it or not are fairly mild and in a lot of them the market actually goes up so what happens is though people get caught up in these short-term swings that happens by the time like in 2011 we went down 20% in a couple of weeks because of the downgrade of US debt from triple-a that double a-plus but it wasn’t material to the economy and so corporate earnings weren’t affected and the market bounced back very quickly so those those types of sell offs tend to rebound very quickly it’s the recession the deep recession driven sell offs that that are much more lasting and difficult to manage and that type of thing so so we have a hedging strategy now that actually uses a trigger that it’s proprietary right now but it uses shorter term rate relationships to tell us when we’re going into what I would call a severe yield curve conversion which again these severe Yoker inversions have preceded every major recession or severe recession going back to the to the 20s and we have really good data at least going back to the 50s but I’ve also studied some great depression information as well that’s not quite as reliable but we have very solid information going back to the mid 50s on yield curve memories so so I’m digressing the lab it wouldn’t happen but I did want to let you guys know about that anyway since that’s something that we’re offering in the future is is a hedging important folios as opposed to selling everything or reducing exposure you can with we can hedge in portfolio using probably normally we’d use S&P 500 index options and so it’s like buying insurance you know if you go overseas you buy travel insurance you know because you hope you don’t have any problems but you know you got travel insurance and it’s the same thing here you hope the market keeps going up but you know what if if if our signal is right and it’s really going to get ugly out there you want to know what your downside is and with this strategy we can protect anything greater than a 5% downside to the portfolio with about a 5% cost for a year to the portfolio so that if the market is up then and say the market is up 25% and we’re performing in line then our client portfolios will be up about 20% so you’re just giving up a little bit of the upside to protect against significant downside and it’s something we also offer if anyone is nervous about the economy in the market for whatever reason I may disagree with them but I can say you know what well we can hedge I mean if you’re right then then you know you’re protected if I’m right you’re still in it and they’re gonna bring this over yeah exactly well actually I’m going to get into that when we have a long term presentation on inflation and the effect on different asset classes okay and as I’ll get into here in a minute I would argue we’re coming out of a deflation cycle into a reflation cycle so inflation is gradually going to go higher and higher if the cycle persists that we went through from the 1930s into the 40s 50s and 60s so but it does bounce around a lot as you can see on the pages of 3 & 4 of the newsletter that we have there for you it shows annual return numbers going back to 1926 for stocks bonds t-bills and inflation and it does bounce erratic and bounced around quite a bit but I would argue that it’s probably will probably be replating for the next 20 or 30 years if history repeats itself anyway ok any other thoughts about the markets or [Music] well you know in terms of I don’t I I quite Frank know and a whole lot of time worrying about the short-term movements in the market a lot of people do in fact I would say most of my peers to spend most of their time doing that we focus on trying to invest in great companies that we think you know we’re gonna have a great business for a long time into the future basically what I use a formula that that I’ve done ever since I got into the business but I found out it’s some at one point that warn’t that’s I’m actually Baltimore Buffett’s formula which is its first and foremost you want to understand the companies that you’re investing in you know think you really have a good idea of what they’re doing and their products and services and then number two you want to be able to make the argument that they have an enduring competitive advantage that that whatever they’re doing is going to be difficult for somebody else to get in and and break it up and really compete with them and then number three you want to have a management that you think okay these guys know what they’re doing they can execute and then last but not least you look at valuation is this company at a reasonable valuation not cheap but is it reasonable and it’s Warren Buffett says you want to buy great companies at a reasonable price not cheap cometh and not not poor companies at a cheap price or mediocre companies at a cheap price so I agree with that philosophy and then the one thing that that as I said I found over the years is that we do have this signal now for four major recessions and so I want to do that after going through 2008 and 9 and I just thought I really don’t want to do this again I need to have a plan here but unfortunately the things like the crashes in 87 you just can’t predict those you just gotta ride through them and just know that they’re gonna happen from time to time and there’s really not much about it a lot of people think there’s stuff you can do about it but there’s really I mean what’s a timing signal for figuring out when the computers are all going to go in sync and just decide to keep selling the market you can’t really produce that and you can’t predict how far down it’s going to go I was a broker in New York in the crash in 87 October 19 and as we were building up to the crash a lot of the brokers were like you know what’s going on here this doesn’t make sense we I’m gonna leverage up I’m gonna get my clients to buy more or we’re gonna you know get this stuff it’s all real cheap now because we’re down almost 20 percent already before the crash happened well those guys on the crash day they were literally walked out of their offices because they were completely wiped out and so that’s something you gotta be careful of is some of these crazy things that happen you can’t know how far they’re gonna take it and so you just have to stand back and say okay fine whatever do what you got to do on the short-term basis and and just keep in mind that you’re invested in great companies that are gonna be worth more down the road but who knows they may be worth less tomorrow there’s no way to predict that anyway so so I’ll go ahead and get started with the presentation and again feel free to ask any questions that you might have so as I said earlier this is a presentation that I’ve given many times over the years we update it every year this is through 2017 end of last year we use a company called Abbott’s and they’ve been tracking this data since 1926 and that’s also the chart that that’s on the third and fourth pages of the newsletter that’s also hibbons and data going back to 1926 so we’ll go ahead and get started here on the scroll up so the first thing I want to hit here is we’re showing non inflation adjusted returns for the three of the before asset but will not ask that classes but the four things we’re tracking the three outside classes and inflation and we’ve got stocks bonds t-bills and inflation and I know it may be kinda hard for some of you back there to see can you see these lines or really can’t okay good I can scroll in a little bit sometimes – the one I want to go to here though is inflation adjusted returns you can see we’ve had since 1926 we’ve had three periods nineteen twenty eight to forty three seventy to eighty four ninety nine to twenty thirteen where the return on the sp500 was flat the total return inflation adjusted return was flat now of course the the non inflation adjusted return or the actual return was better than that but when you test for inflation that’s what you care about right is what your dollars worth it at the end of the period so I would argue that we’re coming in to one of these periods here after those long flat periods and I’ll have some more information to show you about that why I think that’s the case so I would argue right now we’re just getting started on one of these big up moves right here and the reason for that is because basically contrary to what a lot of people say today valuations are extremely reasonable when you look at them relative to interest rates which is the main competition for stocks interest rates today are have bounced up a little bit but they’re still extremely low on an historical basis and therefore I would argue p/e ratios that is price earnings ratios on the S&P 500 and the market in general can be much higher than they are and so I think there’s a lot more room to the outside just on a valuation basis and what a lot of people are talking about these days it is the fact that we’re slightly higher than the historical average p/e ratio but not much and again we adjust for inflation and then interest rates a good example is in the 70s 70s into the 80s we had as you know we’ve had very high inflation at one point and back then p/e ratios were half what they are today because there’s so much competition for stocks now you have the opposite there’s no competition to speak up for stocks so I think that we’re in a period where there’s the potential for quite a bit of above-average performance over the long run so so on this one we’re looking at distribution rates one of the things in this report that we haven’t by the way this is on our website if anybody wants to get the actual report and review it it’s at Martin capital comm we have a tab therefore we have a several reports that I’ve given over the over many years that are on the website so so this gives you an idea of what a 5% distribution rate looks like and in particular you want to look at it in terms of I’m still learning how to do this thing so so here you can see that that basically with here we’re looking at at four different portfolios basically a hundred percent stock portfolio seventy five percent stocks 25 percent bonds 50 50 and 100 percent bonds these are three strategies that we actually offered Martin capital this is our flexible growth strategy this is our balanced strategy this is our conservative strategy and you can see with all three of those strategies at the end of the period you still you know have money and of course it got a little rough in here in the late 70s early 80s for the 100 percent bond strategy which again that’s not one that we offer or recommend yeah these are I should mention what we’re using here is we’re using the S&P 500 for the stock portion of the portfolio and the 20-year crazy for the bond portfolio and I’ve made a mistake a minute ago where actually we’re not showing 100% bonds on well not here they are down there they’re basically you go to 0 with 100% bonds if just punch or sent over the lung then obviously though with stalks you just have no negative performing periods in here with a five percent distribution rate now this is a fixed rate that is updated every year and fixed for the year with with a ten percent distribution rate everything goes down you’re going to lose all your money eventually at a ten percent distribution rate even with stocks and so that’s something you always have to keep in mind is to be reasonable about your distribution rate and as I showed on this previous one the you even take you can afford to take a higher distribution rate with an all stock portfolio because it makes up the difference in performance and then as you go into a more conservative strategies it’s going to hurt your you’re going to have less money as time goes by but you’re still going to be okay so now we’re going to look at a five year old holding period which is the minimum that we recommend if you’re going to have money in stocks if you have less than a 5 year time horizon on your portfolio you shouldn’t have any money in stocks because it’s too unpredictable as to where things are going to be in the next three four or five years even even though normally as you can see in this the the average return for stocks for a five-year period here is it’s pretty good this is the average portfolio value change in stocks as you can see did much better than the other asset classes in terms of lowest portfolio value actually though bonds have the worst performance on average over a five year period so if you’re looking to be conservative and again this is inflation adjusted okay so if you’re going to be conservative one of the points that make here is you’re actually taking a higher risk without 100% bond portfolio right over a five-year period so you’re really better off if you want to be more conservative going with a balanced or a conservative strategy 50/50 stocks or 7525 the reason for that is because bonds perform often perform inversely to stocks meaning that when the economy’s weak bonds obviously well environment inflation’s low whereas when the economy’s weak stocks don’t do that well and vice versa when the economy is really strong stocks are doing great but bonds aren’t doing so well because of the fear of higher inflation and that’s why these strategies balance it out a little bit so that you’re getting bonds counterbalancing stock performance and stocks counterbalancing the bond performance in various economic periods and so that’s why 100 percent bonds is actually worse than 100 percent stock so if you’re 100 percent bond portfolio you actually taking more risk than you’ll you would be a 900 percent stock portfolio in terms of a five-year return window and getting a lower return as well so any questions on that one right there counterbalance in each other and in fact the way I look at fixed income I think people showing up fixing him for a hedging strategy at a hedge against their equity portfolio your best returns are going to be main stocks over the long run but if you can’t handle the volatility the stock market on short term basis and you don’t want to go through a 40% sell-off in six weeks as we did in 87 out of nowhere well then have bonds because they’re not going to do that you know and they’re going to counterbalance the performance of the stocks and mitigate the sell-off in your portfolio and that that’s why a blended strategy makes more sense than that 100% stocks or 100% bonds which the main point in trend I think everybody knows stocks are more volatile than bonds but but interesting enough our inflation adjusted basis on average five-year average returns bonds do worse in terms of risk so the main point on that is that you should have a blend to reduce risk in your portfolio in volatility you should have a blended portfolio not go go hundred percent bonds so these this is again this is available on our website but we have some more details looking at various distribution rates and types of portfolios and so on and these are these are real numbers going back to 1926 so you get an idea if you have a portfolio that mirrors any of these you know what’s your downside risk could be what your upside potential is how many pickup periods you may have negative returns and so on but I’m not going to get into the details of all that right now so this is a looking at five-year rolling periods since 1926 and these are nominal returns so these are not inflation adjusted returns here because we’re including inflation in this presentation so inflation is the zeros or the opposed along here and then stocks are the black boxes that’s the S&P 500 and then t-bills are the minus signs on here they’re kind of hard to see in some places but over down here anyway and then the plus signs are 100% bonds again this is our on our website if you want to get into it and see more details but the main point I’d like to make with this is that as you can see for the most part since 1926 stocks have outperformed these other asset classes on a 5-year holding return basis the only time stocks underperformed is when you get into deflation which is over here in the 30s and then likewise in in the late 60s into the early 17 to the early 80s and otherwise stocks did quite well and but I have some other charts of the ten-year in the 20-year return periods that show it better than this one so I’ll go ahead and scroll to the next one here so now we’re going to a ten-year holding period for stocks bonds t-bills and I’m looking at blended portfolios and of course now that returns for stocks are greater than the other asset classes and the risk has come down a bit for stocks as well in terms of of the lowest performing periods on a 10-year basis and an interesting of bonds and t-bills are doing much worse than stocks you’re actually taking higher risk on a 10-year basis on saying all t-bill inflation in a portfolio because of inflation a lot of people don’t realize that yeah you’re taking less risk on a short-term basis but if you’re if you’re in T bells for ten years we’re taking much greater risk for a much lower return which is not necessarily should not be your objective right and then percent positive periods stocks have going pretty well here again bonds and tea bells interesting enough they have lower percent positive periods so again less return for more risk and then we get into the numbers here on the ten-year basis and so now this charts a little clearer in terms of the relationships between stocks bonds t-bills and inflation and so here you can see this is a Great Depression in the 30s and then inflation starts picking up here and actually ten-year returns for stocks starts skyrocketing in fact in this one right here you can see stocks are really starting to do well on a ten-year basis and they keep doing that that persists even though and I didn’t realize this until we got until I put this chart together but but we didn’t have a period where where we had a bit of a bump up in inflation and then it rolled over and it kind of came down again but we didn’t hit deflation which is is bad for stocks but good for bonds as you can see bonds did quite well in the deflationary period of the 30s but then stocks came back as we began to reflect and then even though inflation did come down some we still had inflation we didn’t go into deflation so stocks did quite well in this period and bonds did poorly in this per agency they’re underperforming inflation by a pretty good margin which means you’re having a net negative return on your portfolio and then as we get in to a reflation here stock performance starts coming down on a 10-year basis and bonds start picking up a little bit though they’re actually still underperforming against inflation adjusted basis and then so we go through that this is the high inflation of the 70s in the early days and get the ears down there oops so so then then we roll over and inflation starts coming down what I call disinflation and and in this period but up by the way I call this period reflation inflation comes back and then it goes into into inflation and it goes into disinflation so in disinflation stocks and bonds both they’re great you can see that see that the plus signs and the black boxes are doing great all through disinflation then you get into deflation which is in here or at least close to deflation extremely low inflation and we had so this doesn’t really show it but we had some periods in here that where we had negative inflation numbers there’s a lot more volatility in here than what you can see on the chart so stocks did poorly in here bonds were doing quite well and so this is where we are right now as of last year the ten-year return is now better than the ten-year return for bonds and quite a bit better than inflation so now we’re hitting 20 years and now this one is what really brings it home that on a 20-year holding basis is that these are rolling 20-year periods from 1926 to the present there’s no 20 year period that had a negative return for stocks not one this is 1926 they don’t exist so if you’re an all stock portfolio is every 20 year period rolling period you’re making money whereas when you go into bonds and t-bills you still have negative 20-year periods the other point here is look at the and performance stocks are up what is that three hundred and eighty percent on average t pills are almost nothing and bonds aren’t a whole lot better than that so that shows you the risk you’re taking on a very long-term basis of under waiting stocks in a portfolio and here they are the numbers if you want to get into them looking at various factors and then here’s the 20 here’s the chart for the 20-year returns and you can see here of course as was shown in the previous chart there’s no period in here where there’s a zero return for stocks in this entire period and stocks are pretty much beating inflation yeah that stocks are beating inflation literally well they got under a little bit here but but pretty much but not that’s that’s T bonds sorry yeah stocks are beating inflation basically all the way through here there’s one right there where it was right on inflation then one right here but they were still they were still all above inflation but through this entire period so again I would argue that we’re not coming in to this reflation area period here for stocks just as as we had deflation in here and deflation back here that we should be coming out to a similar pattern here as the economy relates now I know a lot of people make the argument that that inflation is bad for stocks but as you can see in this chart it’s actually good initially it’s not until inflation gets to be really high that it becomes a problem for stocks because at that point you have interest rates becoming competitive with stocks in terms of of what they’re paying in yields as I was saying earlier today we have very low yields so there’s not much competition but but as you get higher and higher yields as a response to higher and higher inflation that becomes more competitive for stocks and then at some point it becomes a problem but in the initial stages it’s positive because if you think about it why do you have an inflation you have an inflation because companies are charging more money for their products that’s why you’re having inflation well recharge you more money for their products they’re making more money so inflation initially is actually good for companies not bad as a lot of people will say but there is there does come a time when inflation needs to be high enough and interest rates it gets to be high enough that then it becomes the problem for stocks but that’s not until you get up to something around eight or nine ten percent inflation which we’re a long ways away from we’re currently a little bit under three percent inflation so a lot of the pundits on TV will say or in the paper what have you will say that that three percent or higher inflation is a problem but that’s not true historically I mean as you look at the numbers and that we have the inflation numbers also in this third and fourth page of the newsletter that you can check out as well and it’s kind of interesting how inflation bounces around quite a bit over the years – so would you say that reflation airy environments track bull markets well what I’ve identified here is a long-term pattern of inflation what that means is is we have four periods in a long-term pattern of inflation we have deflation we have reflation high inflation and then this inflation and you go back to deflation and each of those has a different effect deflation is good for bonds bad for stocks reflation is good for stocks bad for bonds disinflation is good for both and I mean I should have to mention high inflation is bad for both that’s this period in here it is bad for both and then reflation is good for both I mean disinflation disinflation this is disinflation and this is going into deflation again so to go through this against it so it can be a little confusing and probably make it any more confusing than it should be but this is basically reflux well this is deflation this is reflation this is coming in to inflation this is disinflation inflation coming down and then this is going into deflation again so dis inflation is good for stocks and bonds because bonds benefit from the fact that inflation is coming down so that’s better for bringing down yields and then stocks benefit because they’re getting less competition from well deflation is typically considered as you get down into the less than 2% range because what happens is inflation moves around quite a bit so start getting under 2% and you know if you after a few months you can shoot down to negative inflation and then bounce back up and that’s what we have basically in this period in here as you can see it was consistently a little bit positive but it doesn’t show you the volatility that was in here so so anyway it it’s a pattern I identified many years ago I’ve never heard anybody talk about it but it’s a pretty significant long-term pattern as you can see there’s a lot of persistency in the performance – as you go through each of these cycles so again the positive news is I would argue we’re going into this reflation e recycled now which is great for stocks in the long run doesn’t nothing does not mean you’re not gonna have some down years and that type of thing but so now here we’re looking at another perspective and these are inflation adjusted returns going back to 1926 so basically again as you get out to 20 years stocks just don’t have any negative periods for inflation adjusted returns however t-bills and bonds have a number of negative periods or fact bonds only about half the time positive on inflation justice basis on 20-year return periods likewise here with on tenure as well bonds and tea bells are having a tough time consistently making money over the long run but you can see as little as your time horizon goes out stocks do better and better and better and as your time horizon goes out these guys are either you know kind of going sideways to down for bonds so now looking at worst performing periods so again with stocks the further you go out the the fewer worst performing periods that you have and to the point where with stocks you always have a positive return on a 20-year basis whereas with these other guys they actually get worse as you go out t-bills and and and tbonz so the longer you’re holding peat bogs the t-bills in your portfolio the more they’re going to contribute to a negative return the reason for having them again though is to reduce volatility on a short-term basis the last thing you want to do is have an all stock portfolio to have the market around 20% and you want to sell everything at that point if you have a 50/50 portfolio of stocks and bonds you may be down only 10% so your volatility is a lot less would you kind of cycle into different bones and different t-bills as you keep that section or just cycles immense like senility well I can tell you right now for our clients that are in the balance of conservative portfolios we’re in very short duration a high quality of fixed income again because we’re using it to hedge the portfolio we’re not trying to make money with the fixed income side of it work we we have it there for a hedge and the thing is as interest rates go up the bonds over time we’re actually going to hurt the performance of a portfolio so on a short-term basis if our objective is to minimize the volatility in the portfolio insofar as we’re using fixed income for hedging purposes and we want to be using more conservative fixed income strategies because we don’t want to be taking risk on the fixed income a lot of times people will put for instance what are called junk bonds or high-yield bonds those are really more part of your stock portfolio if you will because they have a similar volatility to stocks so they’re not a hedging mechanism and I think that’s a mistake a lot of times people make they think all fixed income kind of hedges your portfolio well that doesn’t and I’ve served on the endowment committees for a lot of boards and and I have this conversation these guys all the time is like well that’s great that we have these these high-yield positions but you realize we really should have them associated with the stock portion of the portfolio right again because I’d rather go stock for that type of volatility and risk because they’re gonna do better in the long run than even high-yield fixed income and then on this chart the last one we’re looking at here is average portfolio value change performance and again stocks just go up and up and up as you go out and time and these other guys t-bills are basically flat barely having any returns on an inflation adjusted basis and bonds as you go out get a little bit of a return on inflation basis now these are the numbers that you have with the our latest newsletter doesn’t leave it like that so I’m just going to start out and let me see where we know yeah we got a little bit of time if this starts to be too boring for you guys let me know but I find I find it fascinating I just give you a fair warning that that I’m a numbers guy and I’m like looking at the actual numbers as opposed to again you know theorizing about what it is and that sort of thing and when you look at the actual numbers here it’s very rare to have bear markets on an annual return basis you know I mentioned 1987 you know it was a terrible year at one point but if you’re fully invested in stocks of the name of the year at the end of the year you’re at 5.3 percent that’s not bad it means not great but it doesn’t reflect that short-term volatility and that’s the problem people have with stocks they get way too caught up in the short-term volatility and they forget if you just hang in there and you stay with it it goes up and I think that’s what these numbers show so we have stocks bonds t-bills and inflation these rows and then and then we show inflation adjusted returns for stocks bonds team bills and so as you go along here you know you got some periods the the worst bear market was 1929 to 1932 for down years every year was down and it was horrific as everybody knows I’ve led into the Great Depression and a lot of people never came back into the market ever again and if they if they were still interested in the market we had another pretty good sell-off in 1937 down 35% so that was another major recession driven bear market and that’s the important point here these are recession driven bear markets and in fact all bear markets of any consequence are severe recession their markets mild recession bear market sometimes have up yours and I can show you some of those whoops what they do there so at any rate what’s interesting here though is you get to 1937 and that’s our second bear market in the 30s that’s another one they’re only two times where we’ve had two major bear markets in a 10-year period and that was here in the 30s and when else in the 2000 in 2000 2002 and then 2008 9 or 2008 actually so there’s another similarity there I think with with coming out of this deflationary period into reflation so then so then we bounced around so before World War 2 this is another interesting step the only other time that you really can have you know a decent down market is going into a war the for whatever reasons talking well I should say for whatever reason it makes sense but but the stock market hates going into wars it and and you get you typically get at least what’s interesting here though is in 1940 and 41 we’re going into the biggest war in the history of the world not having really any idea how it’s going to turn out how many people were going to die we only went down less than 10% in 1940 and less than 12% in 1941 that’s not much of a sell-off right going in going into this horrible huge world war with you know millions of people dying and the market just you know trades down a little bit but then if you look at the war years 42 to 45 they’re all up baby 42 is up 20% 43 almost 26 almost twenty forty four over 36 and 45 again this is the biggest war in the history of the world millions of people are dying why is the market going up it’s going up because corporate earnings are going up because of the war effort companies are making a lot of money supporting the war effort so the point of that is that that’s what the market cares about our corporate earnings going up you talk all day long about whatever world issue you want to discuss and even Wars or whatever else but at the end of the day what matters is the market convinced corporate earnings are gonna go up anyway another stat that I looked up many years ago it’s not an S but interesting enough in the civil war New York Stock Exchange we didn’t have the S&P 500 then but the New York Stock Exchange without more than 20% every year during the Civil War we had 600,000 Americans killed on American soil and the New York Stock Exchange what for 20 percent every year in the civil war I shouldn’t be laughing but but it’s it’s a stat that you have to keep in mind that that when people are talking about all you know what if we do this and we do that and that sort of thing you just have to ask yourself is okay it’s really gonna hurt corporate earnings on a long-term basis if we’re going into war is gonna help corporate earnings I mean barring an end-of-the-world scenario I mean yeah if we go to nuclear war and we’re all dead then forget about it but but the point is if that happens you’re not really going to be worried about your portfolio because you’re gonna be dead but short of that wars are good for the market and so there’s a lot of misunderstandings about that as well but the one time that wars have a negative impact on the markets the build-up to the wars the markets don’t like the uncertainty and that’s that’s really a big factor is on short-term basis markets really dislike uncertainty and that’s that’s often what drives a short-term pull backs in the market is uncertainty so so then interesting enough from 1937 we’re down 35% we didn’t have another bear market on an annual basis until I got to keep strolling here until 1973 74 so how many years of that 1937 47 3767 about about 36 years we have 36 years without a bear market on an annual basis I mean everybody’s talking today all we’ve gone ten years or nine years we have to have a bear market we can have any bear markets from 37 to 73 what’s that all about you know now that said there was volatility in during the year and and some of these years we had what effectively was a bear market you know down 20% is a bear market but I’m talking about an annual basis if you’re fully invested to beginning the year if they by the end of the air you’re not we don’t have any bear markets and and in fact there aren’t even that many down markets you know most years are up it you know the down years are fairly fairly rare and so so any rate so then we hit 73 74 and that turns out to be a you know pretty bad bear market here and again this was in the hyperinflation when inflation was really getting bad but then from 73 I mean from 74 I’ll have to scroll the next page but you can look at it as we go through from 74 to 2000 we didn’t even have a correction on our annual basis we didn’t have any years that were down more than 10% well he had three down years they were let’s see we can find them here real quick we had three down years so we had 1977 was down 7.2% 81 was down 4.9 percent and then 1990 was down 3.1 percent that’s it that’s 25 years people are saying that oh we got nine years of a bull market about 25 years without even a correction look at the data this is the data I’m not making this up you know but everybody has all these do well you can’t go more than in years and then it’s all over well if we went 36 years from from 1937 to 73 and then we went 25 years from 1974 in 2000 in that case without even a correction so why can’t the market keep going up just because no it’s been going up for nine years this one went up 25 years without eating the correction now I should mention in that period though we did have as I talked about earlier we had 1987 down 40% in six weeks that’s the problem short-term volatility but again if you were fully invested at the beginning of the year it is hung on you’re up 5.3 on the S&P 500 that’s not too bad I’ll take you know not great but it’s not horrible but in the middle of the years like oh my god what’s happening this thing’s going nuts and that’s the problem is that on a short-term basis the market can be extremely volatile because if you think about it’s kind of a herd mentality the hurt starts running and everybody thinks there’s something they hear I don’t understand I got to get out too they just keep taking it and they just keep running until they stop what what stops a cattle stampede nobody can tell you that cattle start running and at some point they suddenly they stopped running I guess they get tired or whatever but they just stop at some point and it’s the same thing with the market you know that everybody starts running and then it’s some point to get tired and they whatever let’s stop and and then it goes back to corporate earnings again you know what are the corporate earnings gonna be so so that’s that’s pretty much my presentation here for today anybody have any questions or comments very well over the last 18 months as inflation you say GDP well actually no interesting enough we’ve had four plus percent GDP numbers for the last nine years several times we had a couple under Obama for instance that we’re actually higher than this latest number that we’ve had so so GDP does tend to bounce around quite a bit it’s averaged somewhere around three percent since you know the Great Recession and the bear market in the 2008 nine and you know I mean there’s there’s definitely been some stimulus in the economy that you know it’s gonna help GDP in the short term my concern is I was mentioned earlier some of the some others here I think to remain as it lunch is that what everybody has to keep in mind is ultimately comes down to the Fed and you know Congress can do where they want to stimulate the economy but the Fed has the final say and the more you stimulate the economy the more the Fed wants to invert the curve and drive you into recession because they get worried about inflation picking up so I would argue actually that the reason we’ve had such a long expansion is because Congress never really stimulated the economy they held back on doing that for a variety of reasons and I won’t get into the political stuff or whatever but the fact of the matter is we didn’t really have much economic stimulus as we came out of the recession which is very unusual normally you get a lot of stimulus coming out of recessions it didn’t happen this last time but that was a good thing because we ended up with two to three percent GDP growth and so the Fed wasn’t worried about inflation and inflation wasn’t thinking up and so that was actually a positive everybody thinks it was negative but it was sustainable right I mean you’ll take 2 or 3 percent inflation every year right over over negative 2 percent inflation after you’ve gone to 4 or 5 percent in GDP I would say inflation GDP sorry about that so so the point is that a slow-growing economy is sustainable and and the reason it’s sustainable is because the Fed isn’t worrying about inflation isn’t inverting the curve we start stimulating the economy and I would argue you know having some economic stimulus at the beginning after you coming out of recession is a good idea but we didn’t do it this time so it still worked out ok the problem now is we’re stimulating the economy and all that’s going to do is get the Fed to be more aggressive on raising rates and so what Congress doesn’t realize and the president is yeah it sounds great on paper hey let’s get the four or five percent growth but the Fed is in control the Fed has the final say and you go to four or five percent growth and the Fed is gonna crush you okay that’s what they’ve always done you can go back again that’s just historical and if so you gotta put it in that context so my concern right now is is that the Fed is more maybe more willing to invert the curve and drive us into a recession here at some point but for the time being we can enjoy it because you know corporate earnings are going through the roof and and everything is looking great my concern is several years down the road if the Fed says you know hey this thing’s throwing out something around 4% inflation starting to pick up more and more let’s go ahead and break the curve and okay maybe it drives us into recession but whatever well you know turn things around and slow down the economy and and hopefully bring down inflation so so all this stuff has to be put in context I think a lot of times people try to simplify things and say oh great let’s go to four or five percent growth okay but what’s the trade-off on that how long how sustainable is that would you rather have two or three percent growth for ten years or four or five percent growth for two or three years you know which one would you rather have I’d rather have the sustainable you know growth everybody’s kind of doing okay maybe not as great as they’d like but they’re doing all right then then for a couple of years oh wow everything’s gangbusters it’s fantastic and then just getting crushed you know that’s what happens the Fed crushes us eventually as the economy is growing too fast if you will at least in their judgement and an inflation speaking up significantly so so while I’m still pretty bullish you know for the time being and again on a long-term basis I’m extremely bullish but we’ll have another recession at some point and that’s why I’ve got an indicator to predict that you know in terms of a severe recession oh one of the things I wanted to show you here here’s a good example of a mild recession well here’s one 1990 we had a mild recession down 3% are you gonna freak out over that no you know okay we came back a little bit of the great returns we had in previous years a really good one 1982 we were in recession all year the entire year we were in recession Bart was up almost 22% right here is that really something you need to be worried about you know and it was a mild recession that’s my point is it mild what a lot of people in media now they picked up on yield curve inversions that’s being bad but what they don’t realize no it’s not really yield curve inversions it’s severe yield curve inversions and again I’ve got a signal for telling me when we’re going in to a severe yield driven version that it’s going to result in a severe recession and severe bear market but otherwise you know we shouldn’t spend a whole lot of time worrying about yield curve in Bergen and get that signal as oh I’ll be letting everybody know when we hit it and in fact for our clients we’re we’re offering this hedging strategy for free as part of their portfolio management the thing I found though with the study that I’ve done and we’re working on our presentation that I may get next time at one of these events but the what I found is there just aren’t that many bad yield curve conversions that it hit my criteria resulting in severe recessions and severe bear markets or bear markets if you will it doesn’t happen that often so we managed to go another 10 or 15 years before we get one of those signals and but the point is that in the meantime we are watching for it and now now that we’ve gone through these two bear markets and and two recessions in ten years which only happened once before the 30s people are a lot more antsy about stocks and economy and so on and so we have a solution for that too to be ready for the next time that we get a signal of a severe yield curve inversion and right now I would say that signal is quite a ways off and it could even be ten or fifteen years because I think the Fed will invert the curve sometime in the next year or two but dependence on TV don’t get it that’s not a big deal it’s it’s how severe they invert the curve not whether they invert the curve and and what I found is I think again I’m a data guy get into the data I find a lot of times people look at things superficially like actually they’re putting together this hedging strategy I just started off with the assumption hey every recessions bad for the stock market you know it makes sense right recession corporate earnings slowdown bad you know well know the fact when you look at the data I mean yeah thanks slow down a little bit and maybe you get a bit of a correction or something like that but mild recessions now the market just kind of sneezes a little bit and so it wasn’t until I got into the data and saw that I had to rethink I had to think what am I trying to do here am i trying to avoid recessions or am i trying to avoid bear markets I’m trying to avoid bear markets okay and it’s a part of the recession predicts it that’s fine I’ll use that but but I had to recalibrate I had to go from okay we’re going to recession we’re gonna hedge – okay we’re going in a recession all right how bad is it going to be you know and until we reach my my trigger point it’s not bad enough to cause a bad recession and a bad bear market so we’re gonna say fully invested even in the in yield curve inversions and mild recessions because that’s what the numbers show us going back to the lease term in fifties so but but the people talking about the yield curve today which I’ve been talking about as I think a lot of you know here I’ve been talking about this for years for some reason suddenly this arrow is talking about the hill curve and I don’t know if I had any influence on that or not but what story I like to tell is as I was talking with Robin Kaplan the the president of the Dallas Fed he gave a presentation here that I attended and I was talking about him afterwards and I was I mentioned that I thought what they really need to be focused on with the ten-year Treasury yield as in relationship to Fed Funds and that if as they’re moving up the Fed Funds the 10-year Treasury yield is coming down that’s a signal they need to be really careful about not driving us into a yield curve inversion and he was like oh that’s not what’s interesting I saw him on CNBC like a month later and they are asking him what what’s the number one that they cater your hollowing it’s like I’m really watching the 10-year Treasury became because of the potential for a yield curve inversion and so so it’s good you know and I think it’s great that they’re all talking about it now the problem is they still don’t really understand it because they haven’t gone into the data they haven’t actually looked at how it works so so at a rate we do have a strategy now that it’s based on the data that I think will work next time you never know but at least we got a plan so okay anything else all right well it’s a little after 7:00 so we’ll hang out here for a little bit if anybody has any further questions and hope to see again next time thank you [Applause]